Monitoring
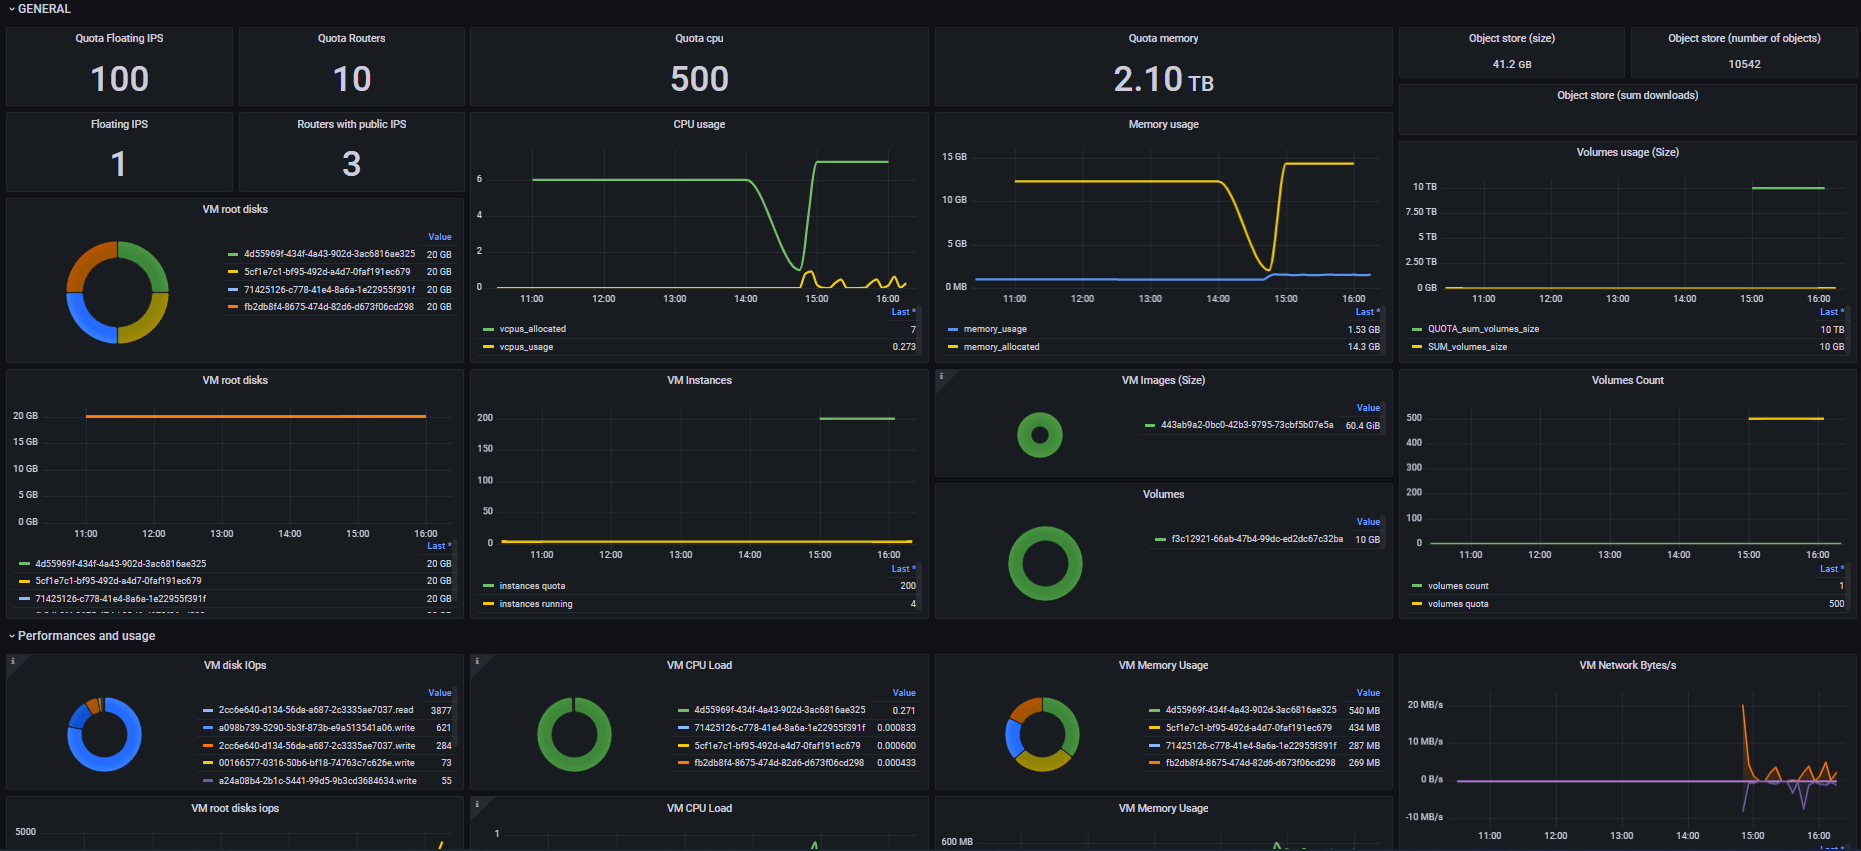
Infomaniak provides a Heat template providing a VM instance with the Grafana dashboard below, automating the retrieval of all metrics available for your project.
The data is retrieved twice an hour.
Otherwise you can retrieve metrics concerning your project with the plugin gnocchi yourself, more details here: Billing.

You can run the command below or download the heat template here .
Tip
- Adjust the parameters
OS_PROJECT_NAME,OS_USERNAMEandOS_PASSWORDaccordingly to your project. - You can specify multiple projects, separate each credential with a comma: --parameter OS_PROJECT_NAME=PCP-PROJECT1,PCP-PROJECT2 --parameter OS_USERNAME=PCU-PROJECT1,PCU-PROJECT2 --parameter OS_PASSWORD=pass_PROJECT1,pass_PROJECT2
Example for your project :
openstack stack create --template https://docs.infomaniak.cloud/documentation/09.others/monitoring/monitoring.yml monitoring \
--parameter OS_PROJECT_NAME=$OS_PROJECT_NAME \
--parameter OS_USERNAME=$OS_USERNAME \
--parameter OS_PASSWORD=$OS_PASSWORD --wait
After a few minutes, you can access your Grafana dashboard using the information tagged output_value using the command openstack stack show monitoring -c outputs.
Example:
+---------+-------------------------------------------+
| Field   | Value                                     |
+---------+-------------------------------------------+
| outputs | - description: Grafana URL                |
|         |   output_key: grafana_url                 |
|         |   output_value: http://195.15.244.61:3000 |
|         | - description: Grafana login              |
|         |   output_key: grafana_login               |
|         |   output_value: admin                     |
|         | - description: Grafana password           |
|         |   output_key: grafana_password            |
|         |   output_value: CZWj5vwL7SSsoKrR          |
|         |                                           |
+---------+-------------------------------------------+
dashboard url is http://195.15.244.61:3000 , login is admin and the password CZWj5vwL7SSsoKrR