Quotas and Accounting
Quotas
Each project has defined quota limits that determine the maximum amount of cloud resources it can use. These quotas apply to resources such as compute instances, volumes, networks, and snapshots.
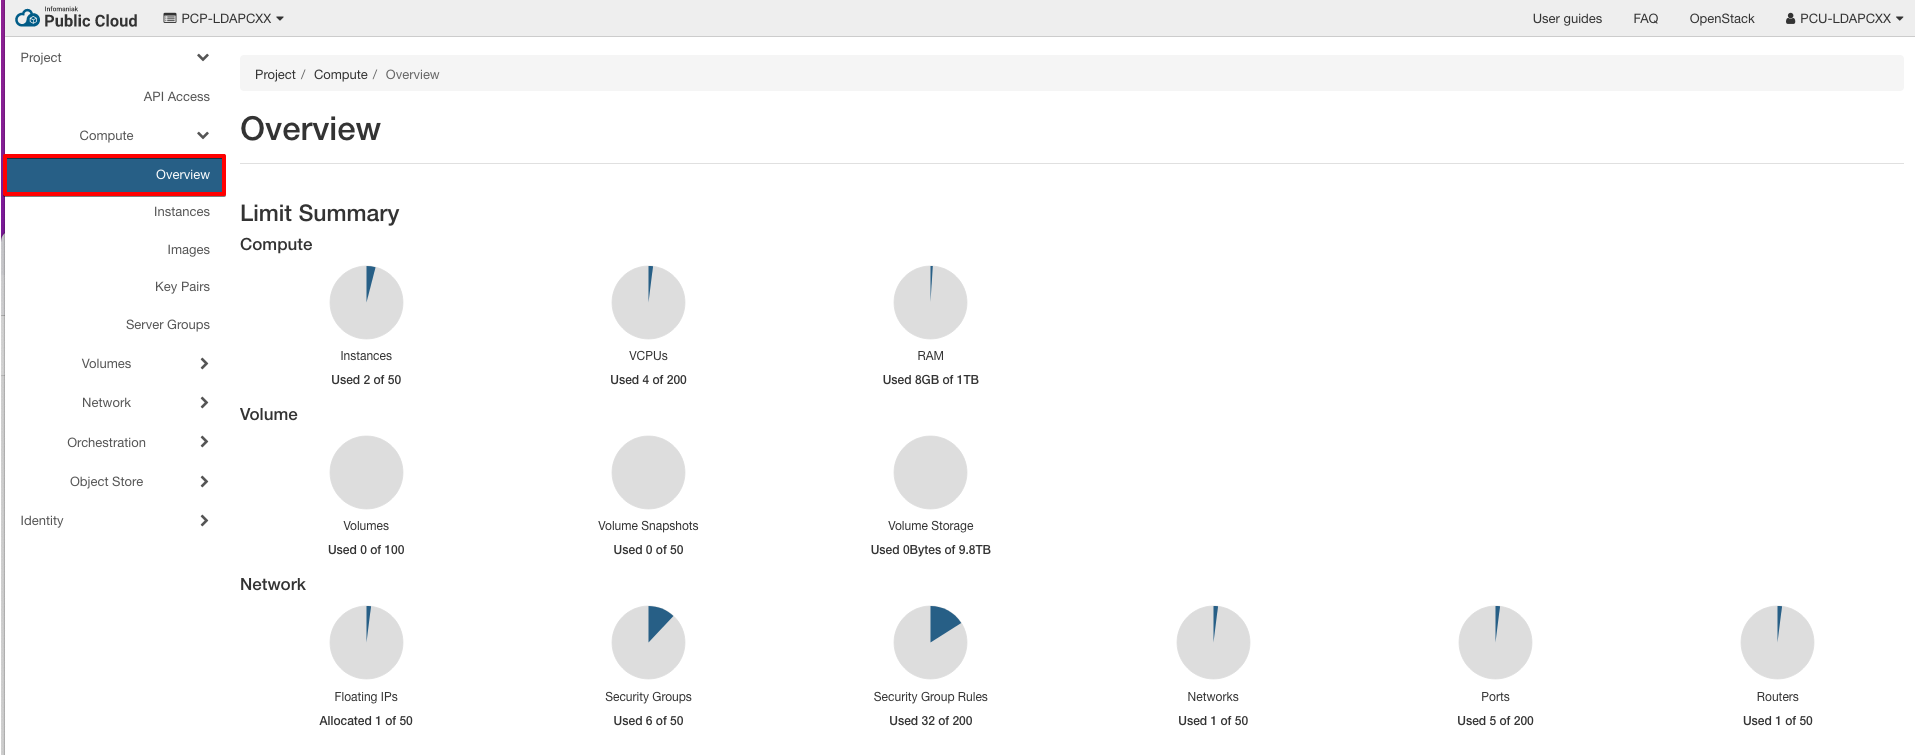
Quotas can be viewed using the Openstack Horizon Dashboard or via CLI:
$ openstack quota show --fit
+------------------------+-------+
| Resource               | Limit |
+------------------------+-------+
| cores                  |    20 |
| instances              |    10 |
| ram                    | 65536 |
| fixed_ips              |  None |
| networks               |    10 |
| volumes                |    20 |
| snapshots              |    40 |
| gigabytes              |  1000 |
| backups                |    40 |
| volumes_CEPH_1         |    -1 |
| gigabytes_CEPH_1       |    -1 |
| snapshots_CEPH_1       |    -1 |
| volumes_CEPH_1_perf4   |    -1 |
| gigabytes_CEPH_1_perf4 |    -1 |
| snapshots_CEPH_1_perf4 |    -1 |
| volumes_CEPH_1_perf3   |    -1 |
| gigabytes_CEPH_1_perf3 |    -1 |
| snapshots_CEPH_1_perf3 |    -1 |
| volumes_CEPH_1_perf2   |    -1 |
| gigabytes_CEPH_1_perf2 |    -1 |
| snapshots_CEPH_1_perf2 |    -1 |
| volumes_CEPH_1_perf1   |    -1 |
| gigabytes_CEPH_1_perf1 |    -1 |
| snapshots_CEPH_1_perf1 |    -1 |
| groups                 |    10 |
| trunk                  |    -1 |
| check_limit            |  None |
| health_monitors        |  None |
| listeners              |  None |
| load_balancers         |  None |
| l7_policies            |  None |
| pools                  |  None |
| ports                  |    20 |
| project_id             |  None |
| rbac_policies          |    10 |
| routers                |    10 |
| subnets                |    10 |
| subnet_pools           |    -1 |
| injected-file-size     | 10240 |
| injected-path-size     |   255 |
| injected-files         |     5 |
| key-pairs              |    10 |
| properties             |   128 |
| server-group-members   |   200 |
| server-groups          |    10 |
| floating-ips           |    10 |
| secgroup-rules         |   100 |
| secgroups              |    10 |
| backup-gigabytes       |  1000 |
| per-volume-gigabytes   |    -1 |
+------------------------+-------+
For the Object Storage quota (in bytes) use the command:
openstack object store account show
$ openstack object store account show
+------------+---------------------------------------+
| Field      | Value                                 |
+------------+---------------------------------------+
| Account    | AUTH_fce31ac00731428ahstd06d5465ff1df |
| Bytes      | 0                                     |
| Containers | 0                                     |
| Objects    | 0                                     |
| properties | quota-bytes='1099511627776'           |
+------------+---------------------------------------+
Info
When displaying quotas, a value of -1 or none means unlimited.
You can change your quotas from your Infomaniak workspace.
Snapshot vs Backup Quotas
It's important to understand the difference between snapshots and backups:
- Snapshots refer to volume-level snapshots (Cinder) — they are point-in-time copies of block storage volumes.
- Backups refer to instance-level backups (Glance) — they typically contain entire system images.
These are tracked and limited by different quota fields:
| Quota Field | Resource Type | Applies to |
|---|---|---|
snapshots |
Snapshots | Volumes (Cinder) |
backups |
Backups | Instances (Glance) |
Snapshot Backend Types
Snapshots can be further limited per storage backend. These backend-specific quotas appear as:
snapshots_CEPH_1snapshots_CEPH_1_perf1snapshots_CEPH_1_perf2, etc.
These fields define per-backend limits. For example:
- If
snapshots = 100andsnapshots_CEPH_1_perf2 = 10, only 10 snapshots can be stored on theperf2backend, but the total across all types must stay below 100. - A value of
-1in a backend-specific field means it is unlimited as long as the totalsnapshotsquota isn't exceeded.
These values appear in CLI outputs for transparency. To summarize, the current limit is 100 snapshots in total.
Snapshot Quota Levels
We have aligned our snapshot quotas with the number of volumes allowed per level. Clients typically perform multiple snapshots per volume, so the quotas are designed to reflect that:
| Level | Volumes | Snapshots |
|---|---|---|
| 1 | 20 | 40 |
| 2 | 100 | 200 |
| 3 | 500 | 1000 |
This allows for basic snapshot rotation (e.g. one active + one backup snapshot per volume).
Infomaniak Quotas Packs description
| Quota name | infomaniak level1 | infomaniak level2 | infomaniak level3 | Description |
|---|---|---|---|---|
| backup-gigabytes | 1000 | 5000 | 50000 | Maximum size of backups in GB's (Sum of all backups) |
| backups | 40 | 200 | 1000 | Number of backups allowed for the project |
| cores | 20 | 200 | 500 | Number of instance cores (VCPUs) allowed per project |
| fixed-ips | unlimited | unlimited | unlimited | Number of fixed IP addresses allowed per project. This number must be equal to or greater than the number of allowed instances. |
| floating-ips | 10 | 50 | 100 | Number of floating IP addresses allowed per project |
| gigabytes | 1000 | 10000 | 50000 | Total space in external volumes |
| gigabytes_CEPH_1_perf1 | unlimited | unlimited | unlimited | Volumes allowed for this volume storage specific CEPH_1 type |
| groups | 10 | 20 | 50 | |
| health_monitors | None | None | None | |
| injected-file-size | 10240 | 10240 | 10240 | Number of content bytes allowed per injected file |
| injected-files | 5 | 5 | 5 | Number of injected files allowed per project |
| injected-path-size | 255 | 255 | 255 | Number of bytes allowed per injected file path |
| instances | 10 | 50 | 200 | Number of virtual machines allowed per project |
| key-pairs | 10 | 100 | 100 | Number of key pairs allowed per user |
| l7_policies | None | None | None | Max number of load balancer l7 policies allowed for the project |
| listeners | None | None | None | Max number of load balancer listeners allowed for the project |
| load_balancers | None | None | None | Max number of load balancers allowed for the project |
| location | User default | User default | User default | |
| object storage | 1TB | 10TB | 100TB | Maximum object storage space allowed |
| name | None | None | None | |
| networks | 10 | 50 | 100 | Number of networks allowed for the project |
| per-volume-gigabytes | unlimited | unlimited | unlimited | Maximum size in GB's of individual volumes. |
| pools | None | None | None | Number of load balancer pools allowed for the project |
| ports | 20 | 200 | 500 | Number of network ports allowed for the project |
| max-projects-per-account | 3 | 15 | 50 | |
| max-users-per-project | 3 | 15 | 50 | |
| project_name | PCP-XXXXXXX | PCP-XXXXXXX | PCP-XXXXXXX | |
| properties | 128 | 128 | 128 | Number of properties allowed for a project |
| ram | 65536 | 1048576 | 2097152 | Total megabytes of instance ram allowed per project |
| rbac_policies | 10 | 10 | 10 | Number of rbac policies allowed for the project |
| routers | 10 | 10 | 10 | Number of routers allowed for the project |
| secgroup-rules | 100 | 200 | 1000 | Number of rules per security group |
| secgroups | 10 | 20 | 500 | Number of security groups per project |
| server-group-members | 10 | 100 | 200 | Number of servers per server group |
| server-groups | 10 | 20 | 100 | Number of server groups per project |
| snapshots | 40 | 200 | 1000 | Total number of volume snapshots allowed per project |
| snapshots_CEPH_1_perf1 | unlimited | unlimited | unlimited | Snapshots allowed for this volume storage specific CEPH_1 type |
| subnet_pools | unlimited | unlimited | unlimited | Number of subnet pools allowed for the project |
| subnets | 10 | 50 | 100 | Number of subnets allowed for the project |
| volumes | 20 | 100 | 500 | Total volumes allowed for the project |
| volumes_CEPH_1_perf1 | unlimited | unlimited | unlimited | Volumes allowed for this volume storage specific CEPH_1 type |